作者:陳頤杰、莊暐明、黃郁玲
本文為國立交通大學經營管理研究所《Financial Management》學期計畫期末報告之部分內容
Part 1: Company description
- Brief description of the company
Taiwan Semiconductor Manufacturing Company Limited (thereafter, TSMC or the company) was founded in 1987 in Hsinchu, Taiwan. The company is a renowned contract-based manufacturer of semiconductor integrated circuits and related services.
TSMC adopts a pure-play strategy where the company neither designs, produces or sells products under its own brand, but supplies for many customers at the same time. The strategy earns the company trustworthiness from its customers who are otherwise direct competitors of TSMC. TSMC sells semiconductors for integrated device manufacturers (or IDMs) such as Intel, TI, Motorola, Samsung, Philips, and Toshiba in foreign markets, as well as Winbond and Macronix in the domestic market.
Given its original business model, TSMC effectively utilizes its long-term assets to increase yield, as well as heavily invests more in new foundries. Meanwhile, scaling up its foundries allows the company to separate lines for each of its customers, therefore ensuring privacy and eventually bringing the company more orders.
TSMC has a leading market share of 52% (2019), 17% more than Samsung, its main competitor. The major customers of TSMC include Apple (US, 23%), Huawei, and Hisilicon (these two Chinese companies together contributed 14% of TSMC’s 2019 revenue).
In FY 2018, the relative revenue sizes in each of its six territories are: the US (61.4%), China (17%), Taiwan (7.6%), EMEA (Europe, the Middle East and Africa, 6.9%), Japan (5.6%) and Others (1.5%). The stock of TSMC is traded in Taiwan SEC (2330), while its American Depositary Receipt is traded in NYSE (TSM).
We identify four external factors that could have adverse impacts.
- Political turmoil: growing tensions between the U.S. and China over trade disputes has involved TSMC and affected its business with Chinese customers. For instance, in July 2020, TSMC confirmed that “it would halt the shipment of silicon wafers to Chinese telecommunications equipment manufacturer Huawei and its subsidiary HiSilicon by the 14th of September.”
- Financing hurdle: given its enormous size of investment in PPE for future growth, and the cyclical nature of the foundry industry, TSMC may periodically depend on loan thus is more sensitive to interest rate change than many other smaller competitors. An increase in interest rate would largely drive up the cost of capital for the company, and largely reduce its profitability.
- Growing stakeholder awareness: sustainability issues, such as energy source, are affecting the operation of TSMC. For example, in July 2020 the company signed a 20-year electricity purchase contract with Ørsted whose offshore wind farms are still under development.
- Threat of cybersecurity: despite enjoying scalability and high level of automation, the production lines of TSMC face a growing threat of internet attacks. One of such events was on August 3rd, 2018, when three of its foundries were attacked by computer viruses adapted from WannaCry. A loss of NT$2.6 billion was reported.
- Financial performance (in million NTD)
Table. 1
| 2019 | 2018 | 2017 | |
| FCF | 253,248 | 242,558 | 247,488 |
| ROIC | 18.55% | 19.91% | 20.79% |
| MVA | 1,041,688 | 915,796 | 773,913 |
First, we identify FCF slightly decreased from 2017 to 2018 when NOPAT did not change much. This was due to an increase in its net investment in operating capital that the company purchased operating long-term asset, which decreased its FCF. This interpretation is supported with the increase in Payables to Contractors and Equipment Suppliers account from 2018 to 2019, signifying an increase in operating long-term asset.
Second, we identify a decreasing ROIC for three consecutive years of which the cause, we argue, was increased operating capital. The company has increased its operating capital (e.g., new foundry) hence decreased its ROIC. This interpretation is supported by the increase in Property, Plant and Equipment account from 2018 to 2019.
Finally, we observe an increasing MVA signaling public market investors have been optimist about the company despite decreasing ROIC and fluctuating FCF in the past three years. Our interpretation is that investors are confident in the growth of semiconductor market as well as the company’s capability to exploit the profit opportunities. An increasing MVA supports the management in executing its current strategy, which is expansion for the focal company.
Part 2: Financial statement analysis
For comparison between companies in the same industry, we follow the academic practice to locate our focal company by its US SIC code 4899 Communications Services, Not Elsewhere Classified. However, this classification does not enable us to identify companies of the similar business model in the semiconductor industry. Instead, we rely on 2 experts to identify the companies that are also in foundry business model for comparison purpose: United Microelectronics Corporation (UMC聯華電子) and Semiconductor Manufacturing International Corporation (SMIC中芯國際).
- Summary of financial ratios (TTM)
Table. 2
| Ratio | TSMC | INDUSTRY |
| Liquidity | ||
| Current ratio | 1.39 | 3.16 |
| Quick ratio | 1.22 | 2.64 |
| Asset management | ||
| Inventory turnover | 6 | 4.74 |
| DSO | 59 | 46.63 |
| Fixed asset turnover | 0.88 | 0.4 |
| Total asset turnover | 0.49 | 0.62 |
| Debt management | ||
| Debt ratio | 28.38% | 50.6% |
| TIE | ||
| EBITDA coverage | ||
| Profitability | ||
| Profit margin on sales | 37.95% | 25.78% |
| Basic earning power | 17.21% | 15.6% |
| Return on total asset | ||
| Return on common equity | 20.94% | 19.95% |
| Market value | ||
| Price/Earnings (P/E) | 26.1 | 16.4 |
| Price/cash flow | 56.87 | 37.64 |
| Market/Book (M/B) | 6.56 | 2.62 |
Liquidity
Lower Current ratio and Quick ratio signify the company has less current asset against its current liability compared to industry average. Although TSMC enjoys business reputation, its risk of debt repayment remains, as the financing hurdle risk we identified earlier.
Asset management
As Inventory turnover demonstrates, the company holds less inventory, therefore enjoys lower NOWC and a higher FCF. Consequently, the company enjoys a higher stock price. On the contrary, a higher DSO indicates the company has higher level of Receivables, leading to higher NOWC and lower FCF, which may decrease its stock price. While the company outperforms its counterparts in Fixed asset turnover, we do not make a judgement without information of firm age because fixed asset was reported in its historic price. Finally, although the company has a lower Total asset turnover vis-à-vis industrial average, we indicate the need to further separate intangible assets (e.g., patent, copyright, etc.) which vary greatly across companies in this industry.
Debt management
Lower Debt ratio shows the company has less risk of bankruptcy whereas higher TIE indicates the firm cover its interest charges by a relatively high margin, both signaling safety for creditor. Thus, it’s easier for TSMC to borrow.
Profitability
Both Profit margin on sales and Return on asset of TSMC are higher than its counterparts, pointing to a more efficient operation and higher basic earning power. Although industry-wide BEP was only slightly lower than TSMC, we need more information about firm size (i.e., total asset) to make sound judgement.
Market value
Both Price/earnings and Price/cash flow of TSMC are higher than the industry average, showing a better growth prospect. Namely, shareholders are optimistic about the future of company
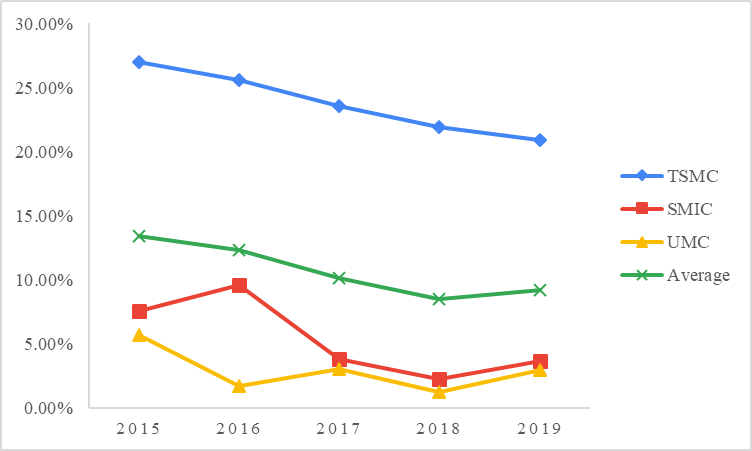
- Rate of return on common equity
Figure. 1
- The Du Pont equation[1] (in million NTD)
Step 1
ROA=Profit margin×Total asset turnover=(Net income)/Sales×Sales/(Total assets)=345,344/1,069,985×1,069,985/2,264,805=15.25%
Step 2
Equity multiplier=(Total assets)/(Common equity)=2,264,805/1,622,095=1.40
Step 3
ROE=ROA×Equity multiplier=15.25%×1.40=21.29%
Step 4
ROE=(Profit margin)(Total asset turnover)(Equity multiplier)=(Net income)/Sales×Sales/(Total assets)×(Total assets)/(Common equity)=21.29%
- Comparative ratios for TSMC, UMC, SMIC, and Industry average
Table. 3
| ratio | TSMC | UMC | SMIC | INDUSTRY |
| P/E ratio | 26.1 | 23.3 | 43.15 | 16.4 |
| Market to Book | 6.56 | 1.71 | 2.52 | 2.62 |
| Price to tangible book | 6.56 | 1.85 | 5.34 | 16.81 |
| Price to cash flow | 56.87 | 13.05 | 21.52 | 37.64 |
| Net profit margin | 37.95 | 11.22 | 9.64 | 25.78 |
| Quick ratio | 1.22 | 2.38 | 2.22 | 2.64 |
| Current ratio | 1.39 | 2.76 | 2.39 | 3.16 |
| Long term debt to equity | 12.7 | 28.2 | 38.5 | 39.5 |
| Total debt to equity | 22 | 37 | 59 | 46 |
| Interest coverage (TIE) | 120.9 | 63.9 | 3.87 | 19.65 |
| Return on asset | 15.99 | 2.26 | 20.61 | 2.20 |
| Return on equity | 20.94 | 4.09 | 29.11 | 19.95 |
| Inventory turnover | 6 | 6.26 | 6.01 | 4.74 |
| Asset turnover | 0.49 | 0.45 | 0.54 | 0.62 |
We look into TSMC’s financing sources, equity and debt, and discuss how the company performs compared to its competitors and industry average.
On one hand, we identify TSMC has a lower P/E ratio compared to SMIC, despite higher Market to book, Price to tangible book, and Price to cash flow ratios. This indicates a more optimistic attitude of investors toward growth potential of SMIC. A possible explanation is the earning of SMIC is much smaller that that of TSMC, thus makes its P/E ratio larger[2].
On the other hand, we notice TSMC has less reserve of current asset against its current liability. Its Quick and Current ratios are well below competitors as well as industry average. This may be a problem whenever interest rates rise and financing becomes costly. Yet, a higher-than-average TIE ratio shows TSMC is well capable of paying its interest expense with its earning at the moment. Moreover, considering TSMC’s relatively lower Long-term debt to equity and total debt to equity ratios, the company still possesses good credibility to creditors.
- Common size income statement
Table. 4
| 2019 | 2018 | 2017 | 2016 | 2015 | ||||||
| Net sales | 100.0% | 100.0% | 100.0% | 100.0% | 100.0% | |||||
| Operating cost[3] | 38.3% | 34.2% | 33.8% | 36.5% | 35.5% | |||||
| EBITDA | 61.7% | 65.8% | 66.2% | 63.5% | 64.5% | |||||
| Depreciation and amortization | 26.8% | 28.4% | 26.6% | 23.6% | 26.4% | |||||
| EBIT | 34.9% | 37.4% | 39.6% | 39.9% | 38.2% | |||||
| Net interest income[4] | 1.2% | 1.1% | 0.6% | 0.3% | 0.1% | |||||
| EBT | 36.1% | 38.5% | 40.2% | 40.2% | 38.3% | |||||
| Taxes | 4.2% | 4.5% | 5.4% | 5.4% | 5.2% | |||||
| Net income before preferred dividends | 31.9% | 34.0% | 34.8% | 34.7% | 33.1% | |||||
| Preferred dividends | 0.0% | 0.0% | 0.0% | 0.0% | 0.0% | |||||
| Profit margin | 31.9% | 34.0% | 34.8% | 34.7% | 33.1% | |||||
First, as observed from the common size income statement, TSMC has an increasing portion of net interest income out of its net sales. Namely, it generates more interest revenue from investing activities than it accrued from financing activities. This indicates the company has good strength in financial managing .
Second, we also notice a downward trend in its Taxes expense for the recent four years. Given its net sales have been increased in the past five years, TSMC enjoys a decreasing tax expense. We look further into this phenomenon and identify it has increasingly reported depreciation expense in the past years, yielding tax deductible expense that helps the company to save on taxes.
Finally, although the profit margin presented in Table.4 seems steady, it is worth noting that the calculation under this table (per textbook guidance) slightly differ from what we arrived at the Du Pont equation early on in section (3). For instance, in 2019 the profit margin calculated by Du Pont equation was 32.2%. The difference was due to this table ignores Other (i.e., non-operating) Income and Expenses, Share of Profits of Associates and Joint Venture, and Other Gains and Losses accounts as were reported in TSMC’s income statement.
- Common size balance sheet
Table. 5
| 2019 | 2018 | 2017 | 2016 | 2015 | |
| Asset | |||||
| Cash and equivalents | 20.11% | 27.64% | 27.78% | 28.69% | 33.95% |
| Short-term investments | 5.65% | 5.62% | 4.82% | 4.82% | 1.42% |
| Accounts receivable | 6.17% | 6.18% | 6.14% | 6.85% | 5.16% |
| Inventories | 3.66% | 4.94% | 3.71% | 2.58% | 4.05% |
| Other current asset[5] | 0.72% | 1.15% | 0.58% | 0.40% | 0.48% |
| Total current assets | 36.32% | 45.53% | 43.04% | 43.35% | 45.05% |
| Long-term Investments | 1.33% | 1.40% | 2.09% | 2.45% | 2.11% |
| Property, Plant and Equipment | 59.71% | 51.29% | 53.34% | 52.89% | 51.49% |
| Right-of-use, Intangible and Other Non-current Assets[6] | 2.63% | 1.77% | 1.53% | 1.31% | 1.35% |
| Total assets | 100.00% | 100.00% | 100.00% | 100.00% | 100.00% |
| Liabilities and equity | |||||
| Accounts payable | 1.78% | 1.64% | 1.51% | 1.45% | 1.19% |
| Notes payable[7] | 12.85% | 7.98% | 8.93% | 8.44% | 5.37% |
| Accruals[8] | 11.45% | 6.67% | 7.57% | 6.98% | 6.24% |
| Total current liabilities | 26.08% | 16.29% | 18.01% | 16.87% | 12.80% |
| Total Non-current Liabilities | 2.29% | 3.45% | 5.54% | 9.44% | 13.43% |
| Total liabilities | 28.38% | 19.74% | 23.55% | 26.31% | 26.24% |
| Preferred stock[9] | 0.00% | 0.00% | 0.00% | 0.00% | 0.00% |
| Total common equity using Total Shareholders’ Equity | 71.62% | 80.26% | 76.45% | 73.69% | 73.76% |
| Total liabilities and equity | 100.00% | 100.00% | 100.00% | 100.00% | 100.00% |
For one, we observed an increasing portion of current liability. This is aligned with our earlier observation that TSMC has less reserve of current asset against its current liability, implying the company is running on less portion of cash. Specifically, the company keeps a lower portion of cash in its asset (as the above common size balance sheet signifies a continuous decreasing portion of cash in the past five years) and makes short-term investment (increasing since the past five years). As we also indicate in early discussion about common size income statement, this maneuver enables the company to generate more interest revenue.
For another, TSMC has an increasing portion of Property, Plant and Equipment and Right-of-use, Intangible and Other Non-current Assets. This points to the fact that the company has been expanding its production level by new foundries[10] as well as new patents (i.e., intangible assets). It makes sense considering the capital-intensive nature of semiconductor business where the earning power of the company largely depends on its technology on which efficient production has been based. Threat of cybersecurity that forces the company to pause production can seriously affect its revenue and thus decrease its ability to pay back (in most of the time, current) liability.
Part 3: Stock valuation
- Stock return data for TSMC and the TAIEX
Table. 6
| Date | TAIEX | Market’s Return | TSMC | TSMC’s Return |
| 2016/1/1 | 8080.60 | 143 | ||
| 2016/2/1 | 8411.16 | 4.09% | 149 | 4.20% |
| 2016/3/1 | 8744.83 | 3.97% | 162 | 8.72% |
| 2016/4/1 | 8377.90 | -4.20% | 150 | -7.41% |
| 2016/5/1 | 8535.59 | 1.88% | 156.5 | 4.33% |
| 2016/6/1 | 8666.58 | 1.53% | 162.5 | 3.83% |
| 2016/7/1 | 8984.41 | 3.67% | 172.5 | 6.15% |
| 2016/8/1 | 9068.85 | 0.94% | 176.5 | 2.32% |
| 2016/9/1 | 9166.85 | 1.08% | 184 | 4.25% |
| 2016/10/1 | 9290.12 | 1.34% | 188.5 | 2.45% |
| 2016/11/1 | 9240.71 | -0.53% | 183 | -2.92% |
| 2016/12/1 | 9253.50 | 0.14% | 181.5 | -0.82% |
| 2017/1/1 | 9447.95 | 2.10% | 185.5 | 2.20% |
| 2017/2/1 | 9750.47 | 3.20% | 189 | 1.89% |
| 2017/3/1 | 9811.52 | 0.63% | 189 | 0.00% |
| 2017/4/1 | 9872.00 | 0.62% | 194.5 | 2.91% |
| 2017/5/1 | 10040.72 | 1.71% | 203 | 4.37% |
| 2017/6/1 | 10395.07 | 3.53% | 208.5 | 2.71% |
| 2017/7/1 | 10427.33 | 0.31% | 214.5 | 2.88% |
| 2017/8/1 | 10585.78 | 1.52% | 216.5 | 0.93% |
| 2017/9/1 | 10329.94 | -2.42% | 216.5 | 0.00% |
| 2017/10/1 | 10793.80 | 4.49% | 243 | 12.24% |
| 2017/11/1 | 10560.44 | -2.16% | 226 | -7.00% |
| 2017/12/1 | 10642.86 | 0.78% | 229.5 | 1.55% |
| 2018/1/1 | 11103.79 | 4.33% | 255 | 11.11% |
| 2018/2/1 | 10815.47 | -2.60% | 246 | -3.53% |
| 2018/3/1 | 10906.22 | 0.84% | 247.5 | 0.61% |
| 2018/4/1 | 10657.88 | -2.28% | 227 | -8.28% |
| 2018/5/1 | 10874.96 | 2.04% | 224 | -1.32% |
| 2018/6/1 | 10836.91 | -0.35% | 216.5 | -3.35% |
| 2018/7/1 | 11057.51 | 2.04% | 246 | 13.63% |
| 2018/8/1 | 11063.94 | 0.06% | 256 | 4.07% |
| 2018/9/1 | 11006.34 | -0.52% | 262.5 | 2.54% |
| 2018/10/1 | 9802.13 | -10.94% | 234 | -10.86% |
| 2018/11/1 | 9888.03 | 0.88% | 225.5 | -3.63% |
| 2018/12/1 | 9727.41 | -1.62% | 225.5 | 0.00% |
| 2019/1/1 | 9932.26 | 2.11% | 221 | -2.00% |
| 2019/2/1 | 10389.17 | 4.60% | 239 | 8.14% |
| 2019/3/1 | 10641.04 | 2.42% | 245.5 | 2.72% |
| 2019/4/1 | 10967.73 | 3.07% | 259 | 5.50% |
| 2019/5/1 | 10498.49 | -4.28% | 235.5 | -9.07% |
| 2019/6/1 | 10730.83 | 2.21% | 239 | 1.49% |
| 2019/7/1 | 10823.81 | 0.87% | 259.5 | 8.58% |
| 2019/8/1 | 10618.05 | -1.90% | 259 | -0.19% |
| 2019/9/1 | 10829.68 | 1.99% | 272 | 5.02% |
| 2019/10/1 | 11358.71 | 4.89% | 298.5 | 9.74% |
| 2019/11/1 | 11489.57 | 1.15% | 305 | 2.18% |
| 2019/12/1 | 11997.14 | 4.42% | 331 | 8.52% |
| 2020/1/1 | 11495.10 | -4.18% | 320 | -3.32% |
| 2020/2/1 | 11292.17 | -1.77% | 316 | -1.25% |
| 2020/3/1 | 9708.06 | -14.03% | 274 | -13.29% |
| 2020/4/1 | 10992.14 | 13.23% | 304.5 | 11.13% |
| 2020/5/1 | 10942.16 | -0.45% | 292 | -4.11% |
| 2020/6/1 | 11621.24 | 6.21% | 313 | 7.19% |
| 2020/7/1 | 12664.80 | 8.98% | 425.5 | 35.94% |
| 2020/8/1 | 12591.45 | -0.58% | 426.5 | 0.24% |
| 2020/9/1 | 12515.61 | -0.60% | 433 | 1.52% |
| 2020/10/1 | 12546.34 | 0.25% | 432 | -0.23% |
| 2020/11/1 | 13722.89 | 9.38% | 480.5 | 11.23% |
| 2020/12/1 | 14732.53 | 7.36% | 530 | 10.30% |
| Description of Data | ||
| TAIEX | TSMC | |
| Average return (annual) | 1.11% | 2.49% |
| Standard deviation (annual) | 4.12% | 7.22% |
| Minimum monthly return | -14.03% | -13.29% |
| Maximum monthly return | 13.23% | 35.94% |
| Correlation between TSMC and the market | 0.79 | |
| BETA | 1.39 | |
- Required returns estimated by the security market line (SML)
Table. 7
| TAIEX | Return | TSMC | Return | |
| 2016 | 8080.60 | 143 | ||
| 2017 | 9447.95 | 16.9% | 185.5 | 29.7% |
| 2018 | 11103.79 | 17.5% | 255 | 37.5% |
| 2019 | 9932.26 | -10.6% | 221 | -13.3% |
| 2020 | 11495.10 | 15.7% | 320 | 44.8% |
| Annual average | 9.9% | 24.7% |
We refer to the website of National Statistics[11] of the Directorate-General of Budget, Accounting and Statistics (DGBAS) of Executive Yuan for government bond interest. The interest rate of ten-year government bond issue in 2019 was 0.72% which we used as Risk-free rate in the following calculation.
SML equation:Required return on 〖stock〗_TSMC =Risk free rate+(Market risk premium)(Beta of 〖stock〗_TSMC )=0.72%+(9.9%-0.72%)×1.39=13.48%
- Intrinsic (fundamental) value estimated by market multiple analysis
Table. 8
| TAIEX
P/E ratio |
TSMC EPS | Estimated intrinsic value of TSMC | |
| 2020 (til Q3) | NT$18.70 | NT$19.50 | NT$364.65 |
| 2019 | NT$13.01 | NT$13.32 | NT$173.29 |
| 2018 | NT$16.35 | NT$13.54 | NT$221.38 |
| 2017 | NT$16.86 | NT$13.23 | NT$223.06 |
| 2016 | NT$13.13 | NT$12.89 | NT$169.25 |
- Comparison between current stock market price and stock’s intrinsic value estimated from the valuation model
The valuation model we adopt utilizes EPS and P/E ratios to value a stock, both are ex post to company’s performance. We assume that the company will maintain its superior capability and profitability.
We estimate the intrinsic value of TSMC stock by market multiple analysis and arrive at NT$364.65 however the most current market price was NT$536 on 2021/1/4. This discrepancy is due to a higher perceived expected future cash flow and lower perceived risk by investors who may ex ante perceive a higher profitability due to TSMC’s leading position in advance technology fulfilling the growing demand of more sophisticated semiconductor products. Hence, its stock enjoys a market value higher than its intrinsic value.
- Interpretation of market equilibrium over expected rate of return and required rates of return
To measure the extent of market equilibrium, we first compute an expected rate of return based on constant growth assumptions:
- The dividend is expected to grow forever at a constant rate: g
- The stock price will also grow at this same rate
- The expected dividend yield is constant
- The expected capital gains yield is also constant and is equal to g, the dividend growth rate
- The expected total rate of return (r_s ) ̂ is equal to the expected dividend yield plus the expected growth rate
We follow the instructor’s guidance to estimate dividend growth rate by the average of dividend changes on past five years[12], as the Table.9 shows. Hence, we arrive at the dividend growth rate g=-3.58%. Since the most recent dividend paid D_0=NT$5.00 we estimate the amount of the next dividend D_1=D_0 (1+g)=NT$5(0.96)=NT$4.82
Table. 9
| year | dividend | Change |
| 2016 | NT$ 7.00 | |
| 2017 | NT$ 8.00 | 14.29% |
| 2018 | NT$ 8.00 | 0.00% |
| 2019 | NT$ 9.50 | 18.75% |
| 2020 | NT$ 5.00 | -47.37% |
| Annual average | -3.58% | |
The latest market price of TSMC stock P_0=NT$536 on 2021/1/4, therefore the expected rate of return can be calculated using the Gordon model:
(r_s ) ̂=Expected rate of return=Expected dividend yield+Expected capital gains yield=Expected dividend yield+Expected growth rate=D_1/P_0 +g=4.82/536+(-3.58%)=-2.68%
Then, we compare the expected rate of return, (r_s ) ̂=-2.68%, against the required rate of return estimated from CAPM, 〖Required return rate on stock〗_TSMC=13.48%. Theoretically, the marginal investor will want to buy TSMC stock only if its expected rate of return is more than 13.48%. The price shall reflect the discrepancy and decrease to NT$28.25 from its current level.
(r_s ) ̂=NT$4.82/NT$28.25+(-3.58%)=13.48%=〖Required return rate on stock〗_TSMC
However, this has not happened as we observe its price trend for the past five years on Table.6 where the lowest price was NT$248[13]. We will discuss this discrepancy in the final section.
First, our estimation of Risk-free rate (0.72%) was based on the interest rate of ten-year Taiwan government bonds issued 2019. This rate may be produced by quantitative easing policy widely adopted by central bankers around the globe in the past two years[14]. Under such circumstance, however, government bonds may not suffice as a valid proxy to estimate the Risk-free rate. In other words, the risk-free rate was manipulated and thus failed to reflect the real risk-free rate as perceived by the marginal investor.
Second, when we estimated Market risk premium, we used the average return of TAIEX, the Taiwan Capitalization Weighted Stock Index, to proxy the market portfolio. Yet, as TSMC was heavily weighted in this index[15], our estimation of required rate of return on market portfolio may be biased. Given the average return of TSMC was 24.7% whereas that of TAIEX was 9.9%, we overstated the average return of market using this estimation. Thus, we inevitably input a higher Market risk premium to the SML equation.
Lastly, the issue of using TAIEX as a proxy to market portfolio biased our calculation of BETA, too. Namely, TAIEX itself is highly correlated to TSMC, resulting an overstated ρ_iM=0.79 and thus, an overstated b_TSMC=1.39
To estimate the effect on required return if we were able to correct these issues, as we present in Table. 10 the required return may be different from our current estimation under CAPM. Yet, we do not predict a lower required return because it depends on the extent other variables change.
Table. 10
| Variable Value | ||
| Original | New | |
| Risk-free rate, rRF | 0.72% | (higher) |
| Market risk premium, rM-rRF | 9.18% | (lower) |
| TSMC stock beta coefficient, bTSMC | 1.39 | (lower) |
| Required return | 13.48% | (vary) |
Reference
- http://search.ebscohost.com/login.aspx?direct=true&db=cix&AN=656122470&site=ehost-live
- http://search.ebscohost.com/login.aspx?direct=true&db=dmhls&AN=7EBEB25A-205F-47D1-940B-0AD0524BA395&site=ehost-live
- https://en.wikipedia.org/w/index.php?title=Semiconductor_fabrication_plant&oldid=981575194
- https://en.wikipedia.org/wiki/TSMC
- https://finance.yahoo.com/quote/TSM/
- https://ic.tpex.org.tw/company_basic.php?stk_code=2330
- https://investor.tsmc.com/english/annual-reports
- https://investor.tsmc.com/static/annualReports/2019/chinese/ebook/index.html
- https://kopu.chat/2017/04/08/ic-industry/
- https://statementdog.com/insight/posts/72-%E6%99%B6%E5%9C%93%E4%BB%A3%E5%B7%A5%E9%BE%8D%E9%A0%AD-%E5%8F%B0%E7%A9%8D%E9%9B%BB(2330)%E8%B3%AA%E6%80%A7%E5%88%86%E6%9E%90
- https://statementdog.com/taiex/19-semiconductor-industry
- https://www.stockfeel.com.tw/soc-%E4%BB%8B%E7%B4%B9-%E7%B3%BB%E7%B5%B1%E5%96%AE%E6%99%B6%E7%89%87-system-on-a-chip-%E5%84%AA%E9%BB%9E-%E6%8C%91%E6%88%B0/
- https://zh.wikipedia.org/wiki/%E5%8F%B0%E7%81%A3%E7%A9%8D%E9%AB%94%E9%9B%BB%E8%B7%AF%E8%A3%BD%E9%80%A0
Footnotes
[1] For common equity, we use the Total Shareholders’ Equity account from the Consolidated Condensed Statements of Comprehensive Income of TSMC
[2] In Q1 2020, TSMC reported an earning of US$3.9 billion whereas SMIC reported US$51.3 million
[3] Calculated by Total Operating Expenses plus Cost of Revenue minus Depreciation & Amortization
[4] For these five years, TSMC has net interest income
[5] Was not included in textbook guidance, but reported by TSMC in annual report
[6] Was not included in textbook guidance, but reported by TSMC in annual report
[7] Summation of Short-term Loans, Payables to Contractors and Equipment Suppliers, and Current Portion of Bonds Payable and Bank Loans
[8] Summation of Cash Dividends Payable and Accrued Expenses and Other Current Liabilities
[9] According to its 2019 annual report, TSMC does not issue preferred stock
[10] https://iknow.stpi.narl.org.tw/post/Read.aspx?PostID=16937
[11] https://statdb.dgbas.gov.tw/pxweb/Dialog/viewplus.asp?ma=FM3007A1A&ti=%A7Q%B2v%B2%CE%ADp-%B8%EA%A5%BB%A5%AB%B3%F5%A7Q%B2v-%A6~&path=../PXfile/FinancialStatistics/&lang=9&strList=L
[12] We collapse the quarterly dividends into year of dividend period. We do not use any of Ex-Dividend Date, Record Date, or Distribution Date. Please refer to https://investor.tsmc.com/english/dividends
[13] On 2020/3/19
[14] Refer to p.35 from Central Bank of the Republic of China (Taiwan) on https://www.cbc.gov.tw/tw/cp-302-121446-8faf7-1.html
[15] According to the latest composition, TSMC occupies nearly 31% in the weighting. See https://www.taifex.com.tw/cht/9/futuresQADetail